Data Tables
What are Data Tables Used for and How do Students Use Them ?
Data tables are used to organize data and communicate numerical information that is taken from experimentation to make it easier to see patterns in the results. Students create data tables to help them better organize their data to help them answer questions and make conclusions about what they are experimenting. By creating a data table it is also easier to read and see the data to create a graph from.
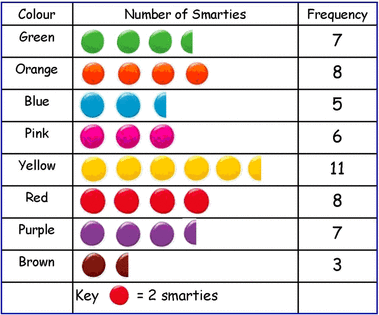
Here is a example of how many of each color were in a bag of smarties using a data table:
Data tables are used to organize data and communicate numerical information that is taken from experimentation to make it easier to see patterns in the results. Students create data tables to help them better organize their data to help them answer questions and make conclusions about what they are experimenting. By creating a data table it is also easier to read and see the data to create a graph from.
Here is a example of how many of each color were in a bag of smarties using a data table:
How to Construct a Data Table
- The first step is to identify the independent and dependent variable in your experiment. Once you decide what each of the variables are, place the independent variable on the left side of the table and the dependent variable on the right side. This is how you know what to label the columns.
- Occasionally data is order from largest to smallest inside the table, but the usual procedure is to order data from smallest to largest.
- If you are going to conduct multiple trials of data you may need to modify the table for recording. This also allows an increase of confidence in the results. When doing this the dependent column is divided to allow a stop for recording each of the trials. The conductor of the experimenter can find the average of the data using the trials by finding the mean, median, and mode.
- You can transfer your data from the table onto a graph using data pairs and points.
